


Bank Central Asia BBCA IJ - Buy - Solid YTD Jul-24 results
BBCA’s bank-only Jul-24 earnings of IDR4.9tr (+1% m-m / +17% y-y) brings YTD Jul-24 headline profit to
We think the Indonesia banking sector is not going to be immune to the impact from the reciprocal tariffs of 32% imposed on Indonesia by President Trump. The risks to the banking sector are likely to come from predominantly credit qualities specifically towards export-related borrowers and/or slower loan growth for the sector. However, the overall impacts to major banks’ fundamentals remain limited, in our view. Despite year-to-date selling pressures causing major banks to trade at significantly lower multiples and experiencing net foreign outflows (~USD1.4bn for banks versus ~USD1.7bn overall), their high dividend yields suggest manageable downside risks. Our preferred stocks remain BBCA / BMRI / BRIS (all rated Buy).
Limited export-oriented loans
To assess the impact of tariffs on banks, we look at FX-denominated (predominantly are based on USD) loan exposures at major banks. As of FY24, the average FX-denominated exposures for major banks stood at ~14% of their loan portfolio. BBCA has the least FX loan exposure of ~5% of their loans, whilst BBNI has the highest exposure of ~21% of their loans, followed by BMRI ~18% and BBRI ~11%. These borrowers are typically commodity exporters. And they are not only amongst low-cost producers but if needed could potentially redirect their exports to other countries, we think. These suggest relatively manageable exposures from new tariff rates.
Muted loan growth impact
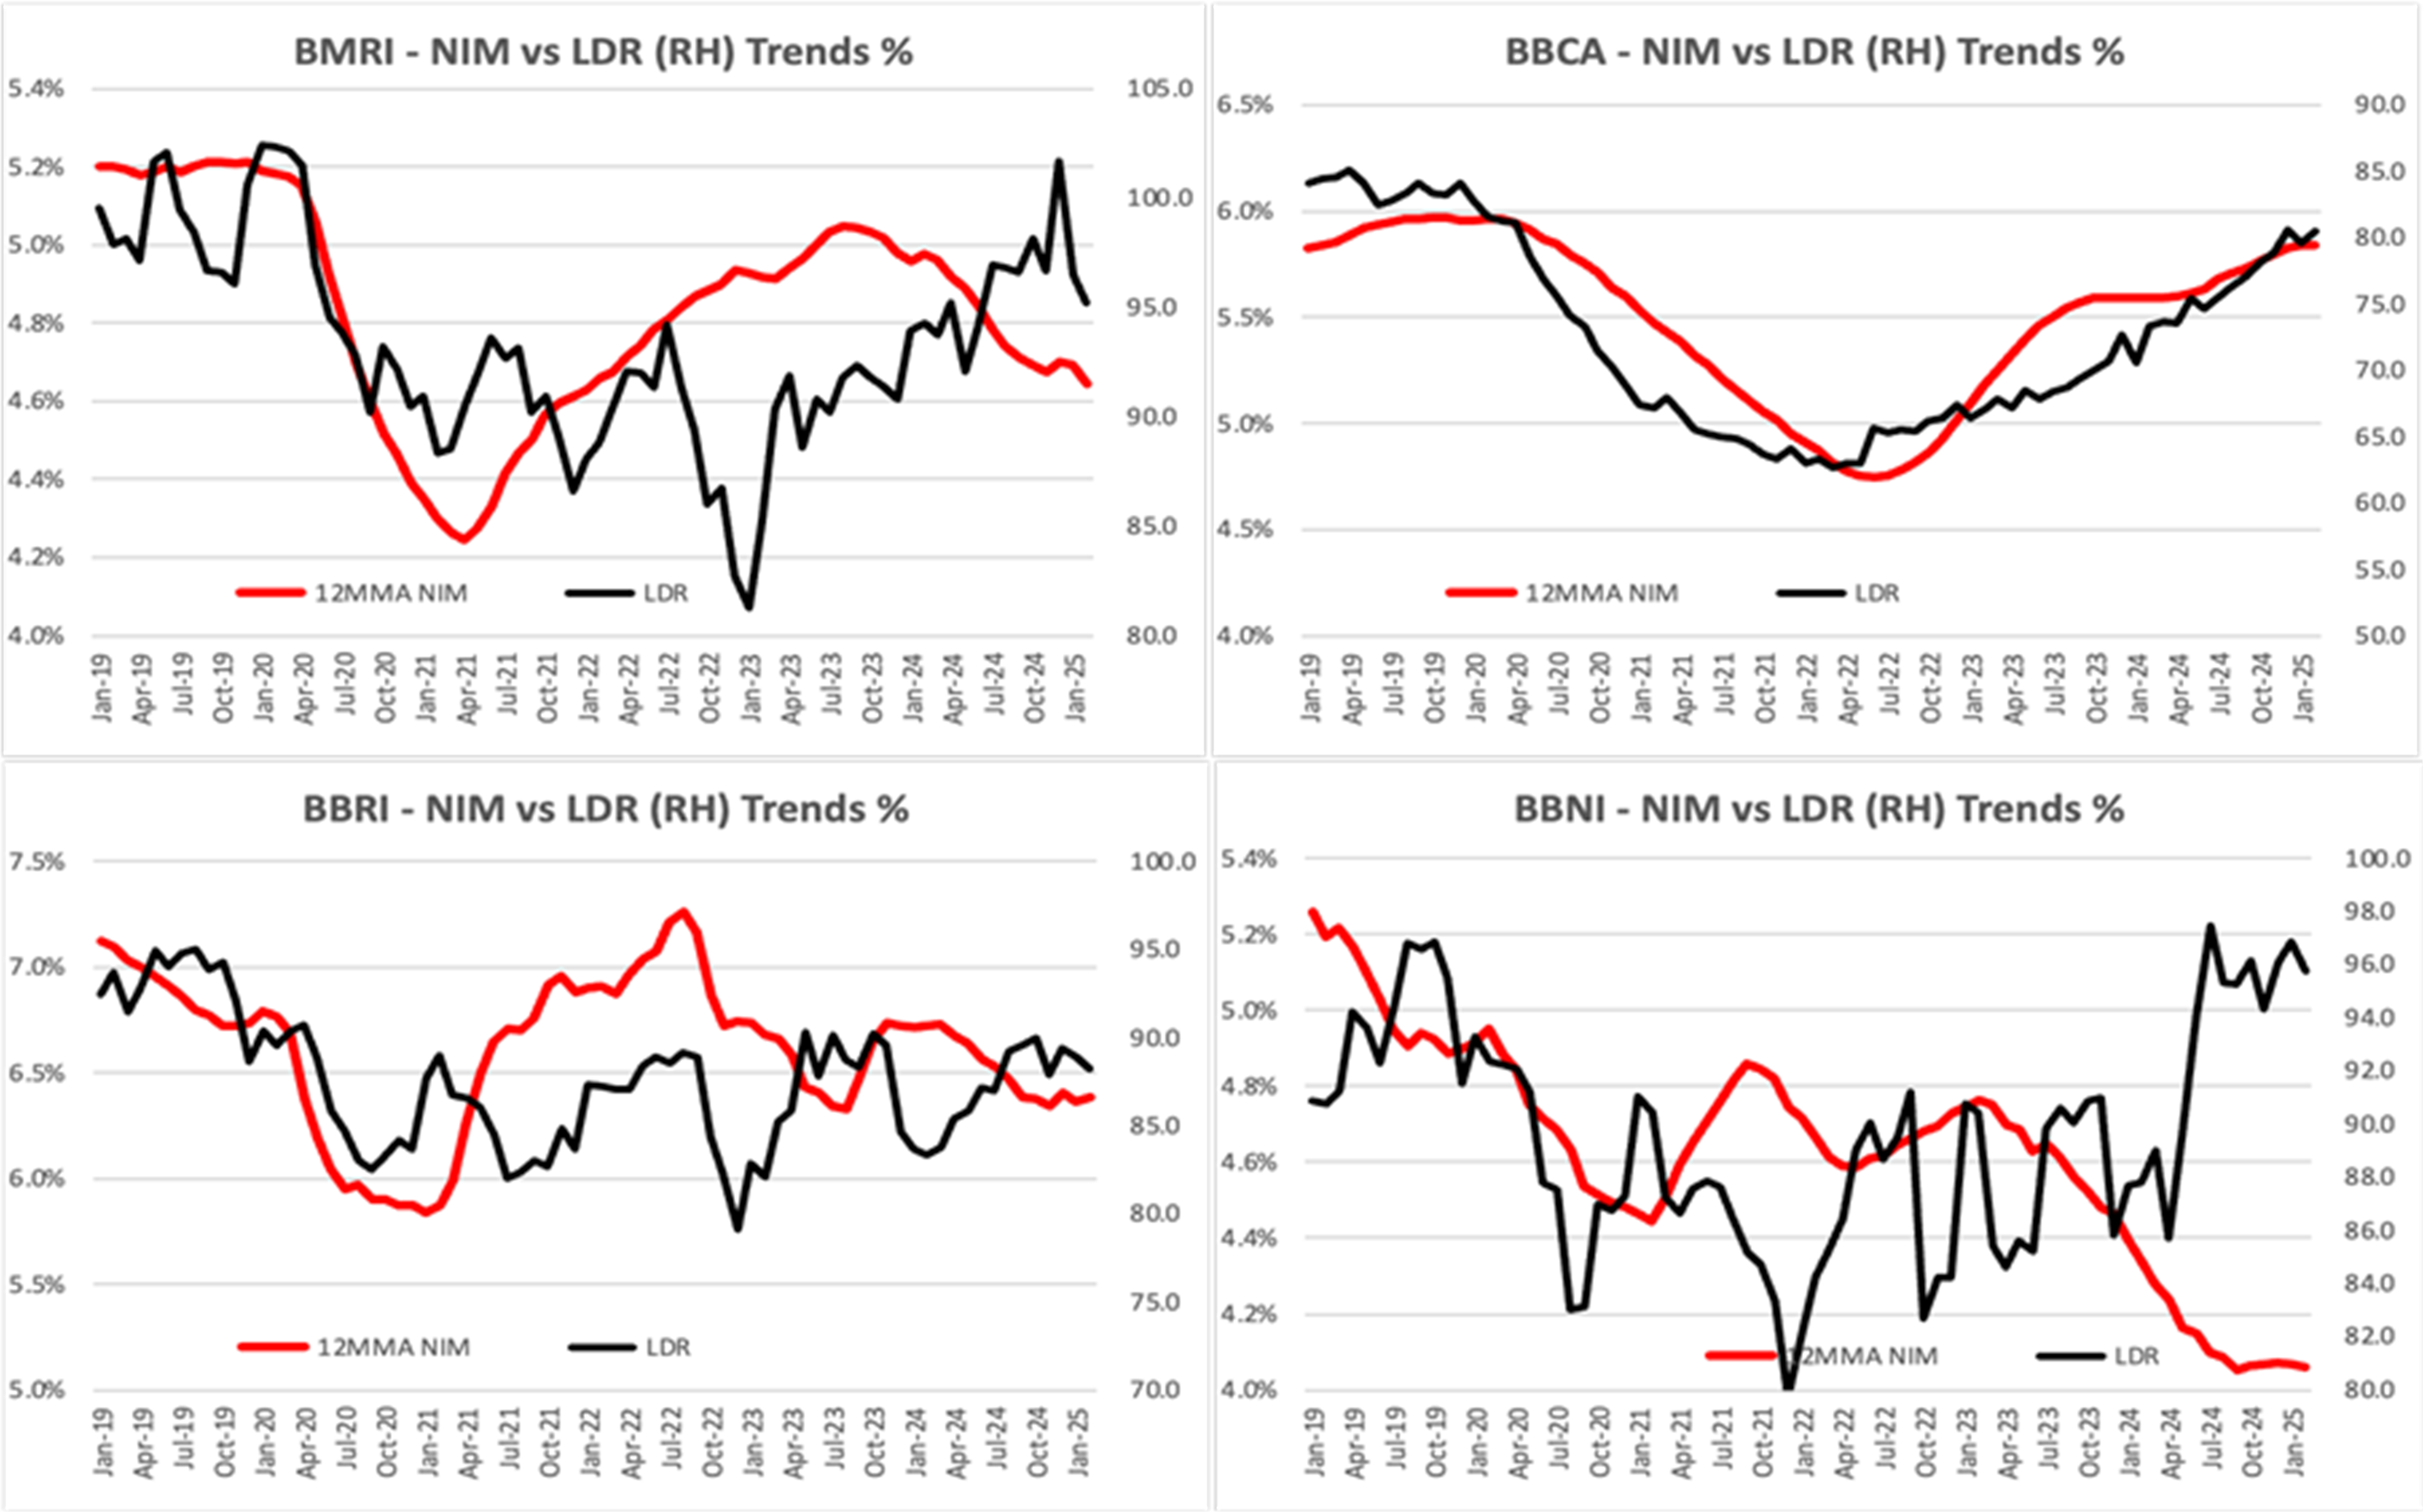
Across major banks, we have seen slower loan growth guidance from management. And these have been reflected in our projections. Specifically, BMRI and BBCA have on average been guiding for ~10% and ~7% loan growth projections – practically half of their respective loan growth achievements in 2024. As we have argued in our recent notes, despite slower loan growth, FY25F earnings profiles for these banks would be better than those in 2024. Specifically, whilst liquidity in the system remaining tight, they may likely see room for some improvements given the projected SRBI maturities amounting to ~IDR287tn (resulting in net liquidity releases of amounting to ~IDR92tn assuming weekly SRBI issuances of ~IDR15tn). This suggests that overall funding costs for major banks could remain stable, allowing these banks to have stable NIMs (unlike in 2022-24 periods where NIMs have been on the decline pushing banks to “compensate” with high loan growth). So far, we have seen overall decent YTD Feb-25 results from major banks (refer to the charts below).
Upside risks from upward loan repricing
Over the past three years, major banks have had declining average lending rates, albeit in recent quarters they have shown some stability despite funding costs have been on the rise. We think one plausible upside risk to banks’ earnings could come from some upward loan repricing. A 5bp uplift in blended lending rates (all else remaining equal) would boost banks earnings by ~0.5-1.5% (with BMRI BBNI and BBRI benefiting more than BBCA, in our view).
Valuations and risks
BBCA — We derive our TP of IDR12,600 using DuPont analysis with key parameters as follows: a risk-free rate of 6.5%, an equity risk premium of 7.8%, beta of 0.8x and a CAR-adjusted ROAE of 24.5%. Our TP implies 5.4x FY25F P/B (vs current price valuation of 4.2x) and a FY25F P/E of 26.0x (vs current price valuation of 21.0x). Key downside risks are worsening economic trends, tighter liquidity competition, and/or higher credit cost and opex growth.
BMRI — We derive our TP of IDR7,600 based on a DuPont analysis, assuming a risk-free rate of 6.5%, an equity risk premium of 7.8%, growth of 11.0%, beta 1.05x and a CAR-adjusted ROAE of 19.5%. We also use 2025F book as reference. The implied multiples at our TP are 2.3x 2025F book and 12.4x 2025F earnings (compared to current multiples of 2.5x and 13.7x, respectively). Key risks to our view are worsening macroeconomic trends, unfavorable regulatory changes, tighter liquidity competition (which would increase funding costs), worsening credit quality (which would raise credit costs), and higher opex.
BBRI — Our TP of IDR5,000 is based on DuPont analysis, with a risk-free rate of 6.5%, an equity risk premium of 7.8%, ROE growth of 9.3%, a beta of 0.85x and a CAR-adjusted ROAE of 18.0%. We also use 2025F book value as a reference. The implied multiples at our TP are 2.3x 2025F BVPS and 12.5x 2025F EPS. Downside risks include worsening macroeconomic trends, unfavorable regulatory changes and tighter liquidity competition which could increase funding costs. Changes in management may affect the bank’s write-off policies and thus, credit costs. This would ultimately affect the bank’s near-term earnings, in our view.
BBNI — We derive our TP of IDR6,250 based on a DuPont analysis, assuming a risk-free rate of 6.5%, an equity risk premium of 7.8%, growth of 8.5%, beta 1.0x and a CAR-adjusted ROAE of 16.5%. We also use 2025F book as reference. The implied multiples at our TP are 1.3x 2025F book and 10.6x 2025F earnings (compared to current multiples of 1.0x and 8.1x, respectively). Key risks to our view are worsening macroeconomic trends, unfavorable regulatory changes, and tighter liquidity competition (which would increase funding cost), and worsening credit quality (which would raise credit costs), and higher opex.
BRIS – We derive our TP of IDR3,800 using DuPont methodology, with key parameters as follows: a risk-free rate of 6.5%, an equity risk premium of 7.8%, beta of 1.2x and a CAR-adjusted ROAE of 18.1%. We have also used 2025F book value in deriving our TP. Our TP implies a FY25F P/B of 3.4x and a FY25F P/E of 21.5x. Risks are worsening macroeconomic trends, unfavorable regulatory changes, tighter liquidity competition that could increase funding costs, worsening credit quality that could raise credit costs, material management changes, and/or persistently high opex.
INVESTMENT RATINGS
A rating of ‘Buy’, indicates that the analyst expects the stock to outperform the Benchmark over the next 12 months. A rating of ‘Neutral’, indicates that the analyst expects the stock to perform in line with the Benchmark over the next 12 months. A rating of ‘Reduce’, indicates that the analyst expects the stock to underperform the Benchmark over the next 12 months. A rating of ‘Suspended’, indicates that the rating, target price, and estimates have been suspended temporarily to comply with applicable regulations and/or firm policies. Securities and/or companies that are labelled as ‘Not Rated’ or ‘No Rating’ are not in regular research coverage. Benchmark is Indonesia Composite Index (‘IDX Composite’). A ‘Target Price’, if discussed, indicates the analyst’s forecast for the share price with a 12-month time horizon, reflecting in part of the analyst’s estimates for the company’s earnings, and may be impeded by general market and macroeconomic trends, and by other risks related to the company or the market in general.
GENERAL DISCLOSURE/DISCLAIMER
This report is prepared by PT Verdhana Sekuritas Indonesia (“PTVSI”) a securities company registered in Indonesia, supervised by Indonesia Financial Services Authority (OJK) and a member of the Indonesia Stock Exchange (IDX).
This report is intended for client of PTVSI only and no part of this document may be (i) copied, photocopied or duplicated in any form or by any means or (ii) redistributed without the prior written consent of PTVSI.
The research set out in this report is based on information obtained from sources believed to be reliable, but PTVSI do not make any representation or warranty as to its accuracy, completeness or correctness. The information in this report is subject to change without notice, its accuracy is not guaranteed, it may be incomplete or condensed and it may not contain all material information concerning the company (or companies) referred to in this report. Any information, valuations, opinions, estimates, forecasts, ratings or targets herein constitutes a judgment as of the date of this report is published, and there is no assurance that future results or events will be consistent.
This report is not to be construed as an offer or a solicitation of an offer to buy or sell any securities or financial products. PTVSI and its associates, its directors, and/or its employees may from time to time have interests in the securities mentioned in this report or it may or will engage in any securities transaction or other capital market services for the company (companies) mentioned herein.
ANALYST CERTIFICATION
The research analyst primarily responsible for the content of this report and certifies that the views about the companies including their securities expressed in this report accurately reflect his/her personal views. The analyst also certifies that no part of his/her compensation was, is, or will be, directly, or indirectly, related to specific recommendations or views expressed in this report.
RESTRICTIONS ON DISTRIBUTION
By accepting this report, the recipient hereof represents and warrants that you are entitled to receive such report in accordance with the restrictions and agrees to be bound by the limitations contained herein. Neither this report nor any copy hereof may be distributed except in compliance with applicable Indonesian capital market laws and regulations.
Erwin Wijaya (erwin.wijaya@verdhana.id)